“Liana Shanti” Followers — A Data-Driven Forensic Report
Timeframe analyzed: Aug 2023 – Aug 16, 2025 •
Primary source: SocialBlade “Daily Channel Metrics” (PDF exports & screenshots provided) +
Instagram Stories where follower milestones are highlighted.
Executive Summary (Observations & Questions)
- From 2023 through mid-2025, SocialBlade logs show long runs of mostly positive (“green”) daily follower changes (+20 to +80/day), with rare small negatives.
- Beginning Aug 10, 2025, two different accounts associated with “Liana Shanti” show
synchronized, extreme follower declines for a week:
combined change −6,371 followers
(Account A: −2,894; Account B: −3,477). - On Aug 10, Account B also shows a Media Count −74 (post deletion) coincident with the largest single-day follower drop (−1,570).
- Given the steady July baselines (≈ +50/day), the probability of these August values arising from “ordinary churn” alone is vanishingly small (see Probability).
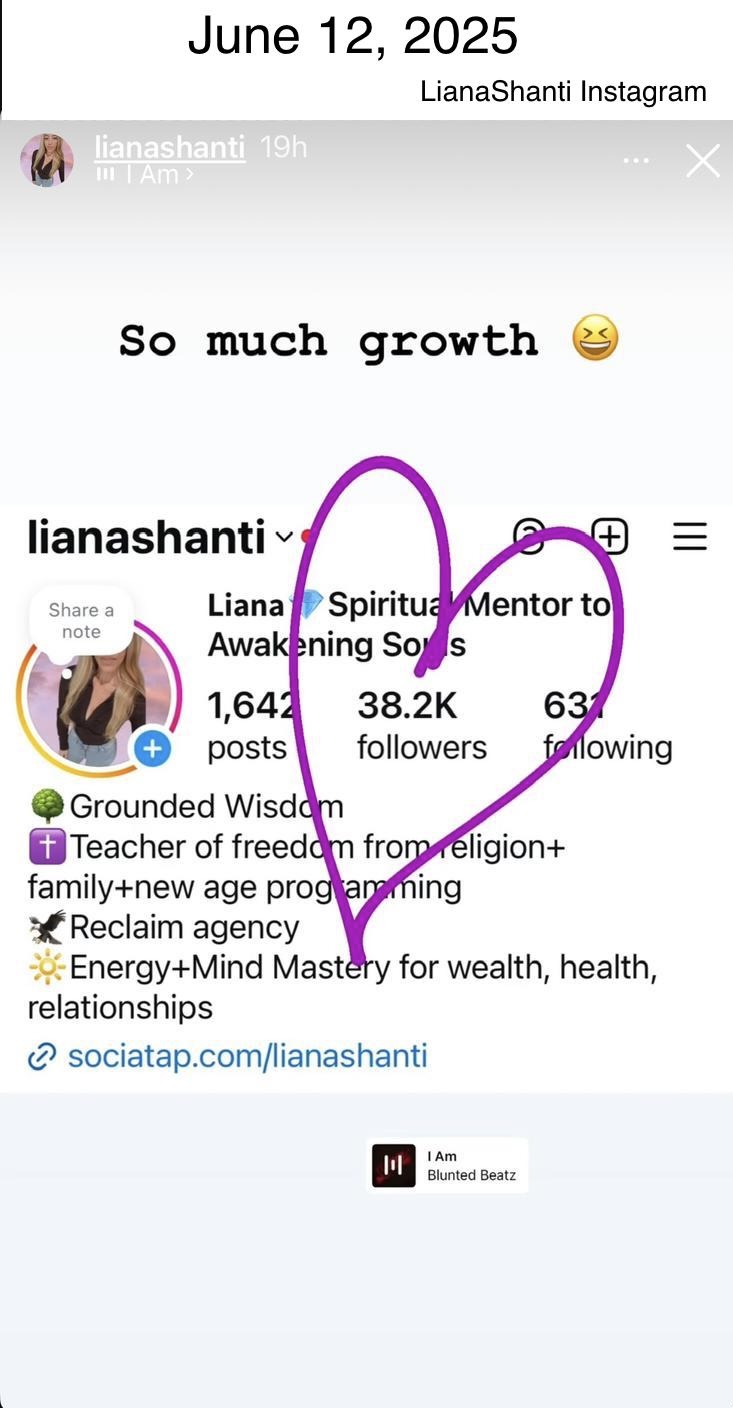
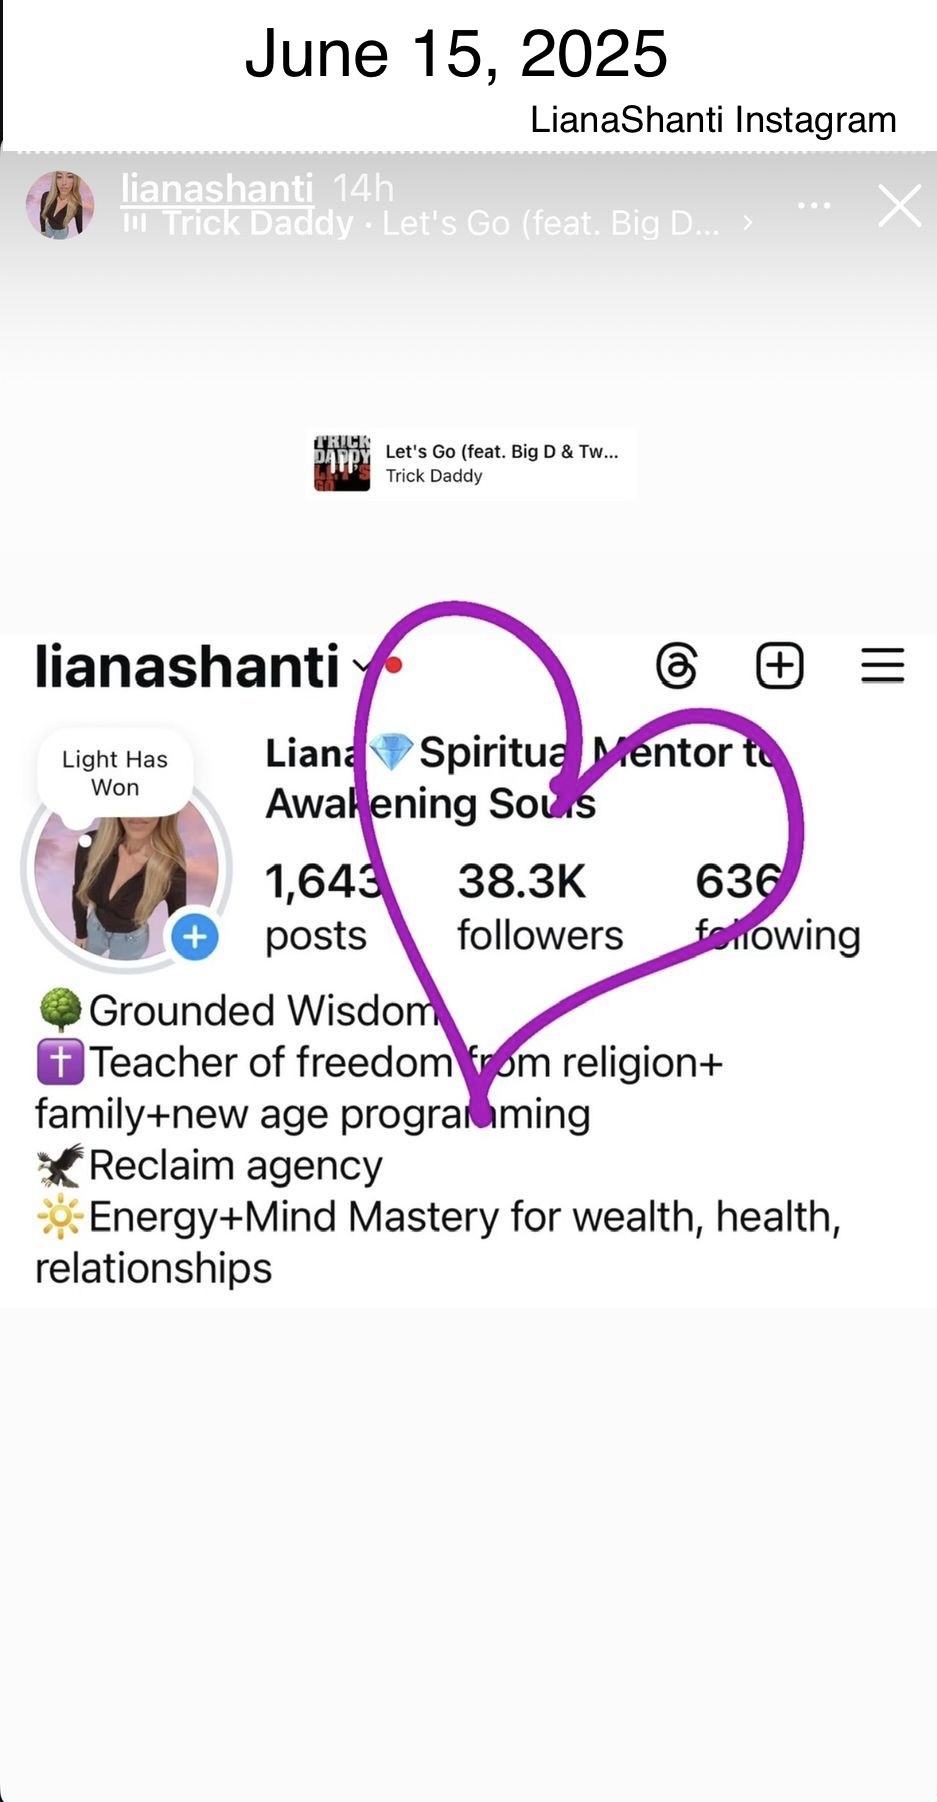
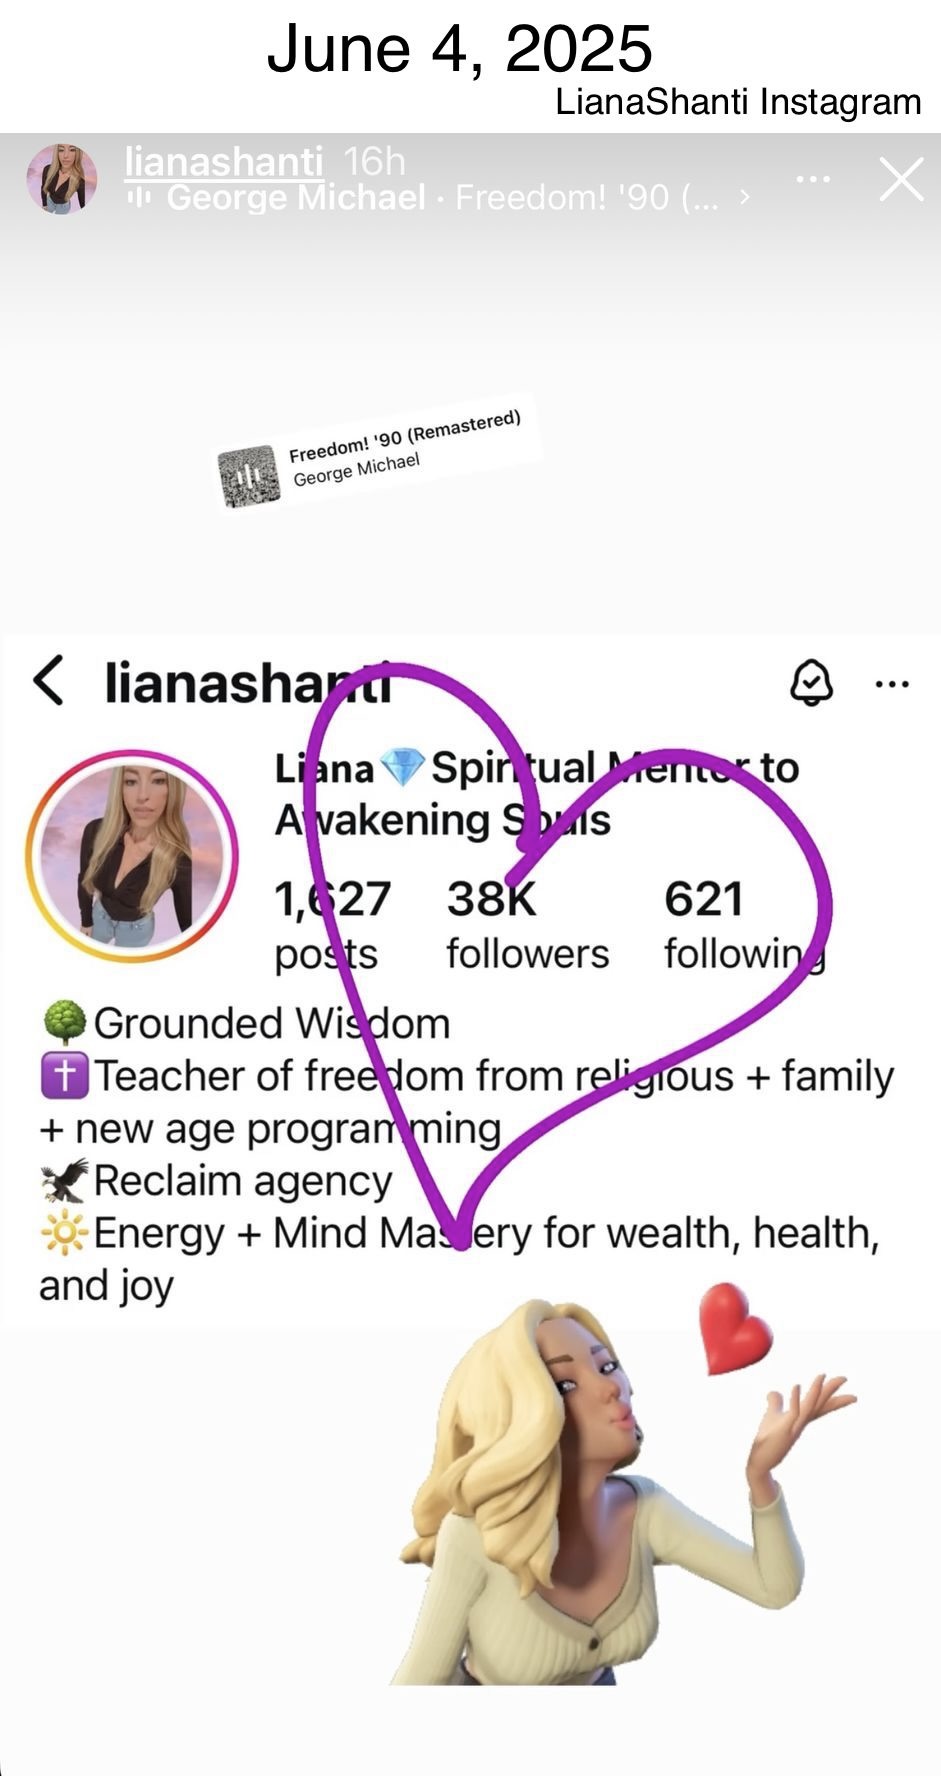
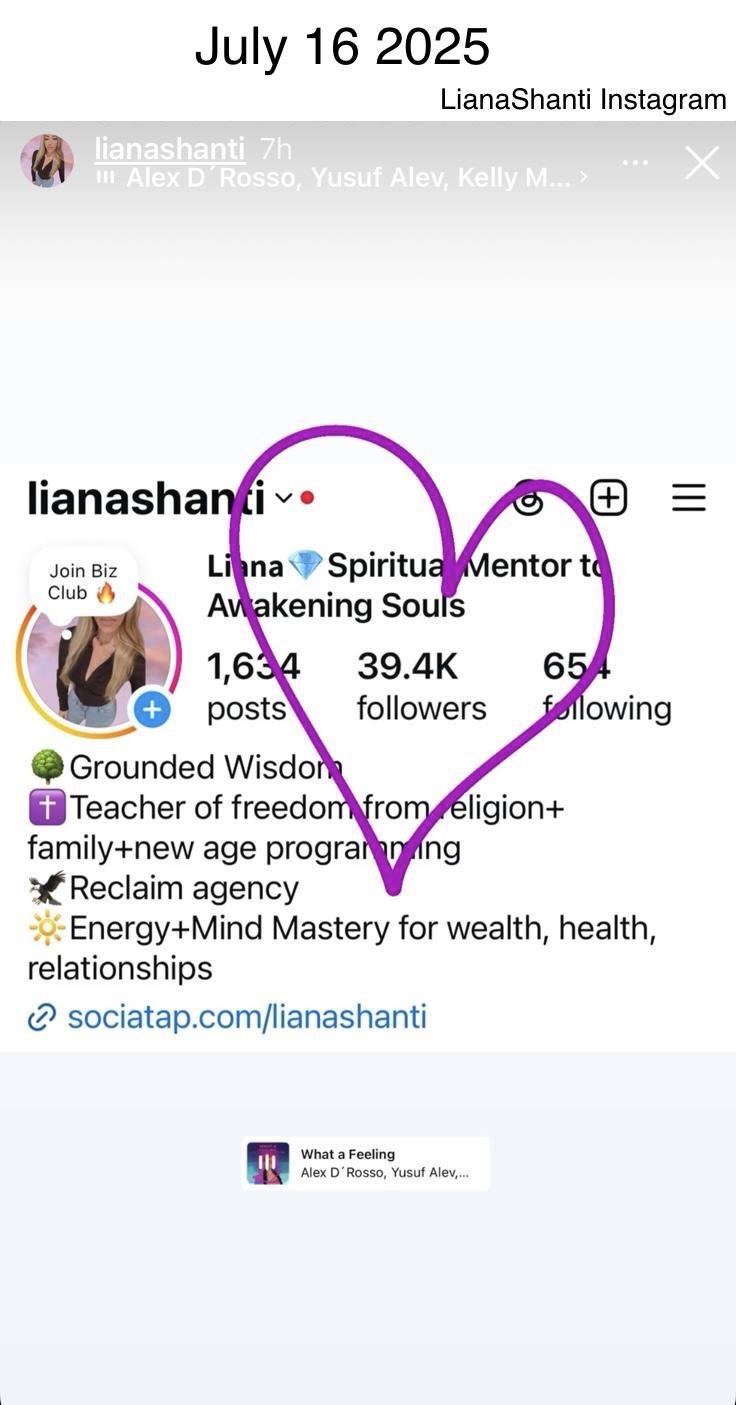
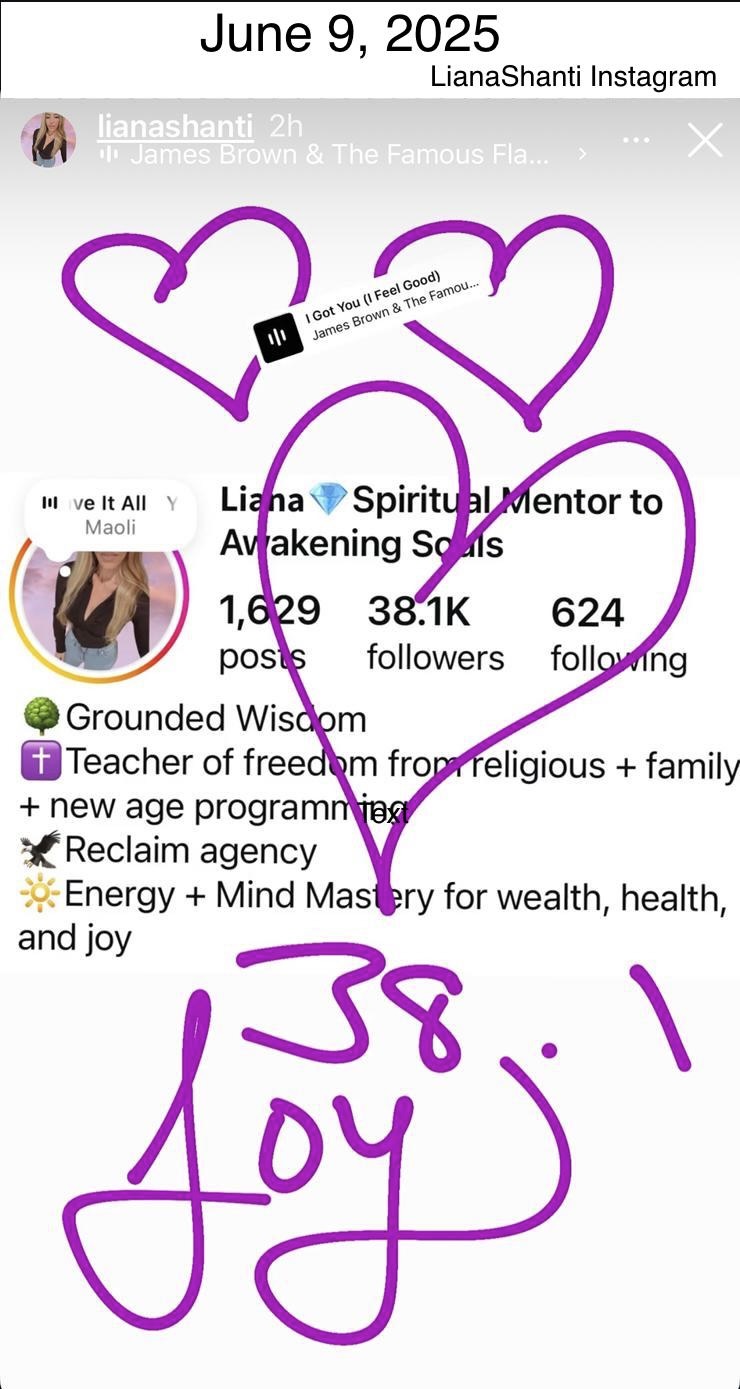
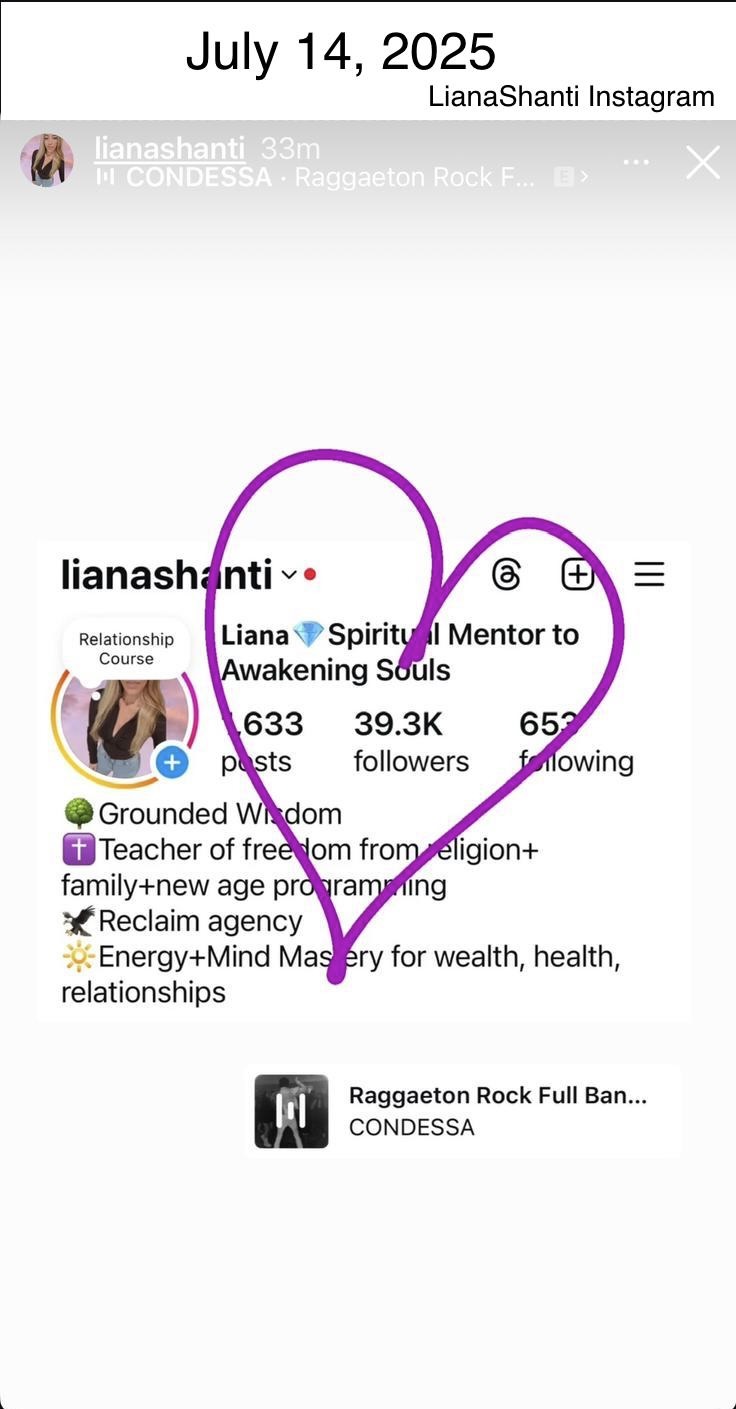
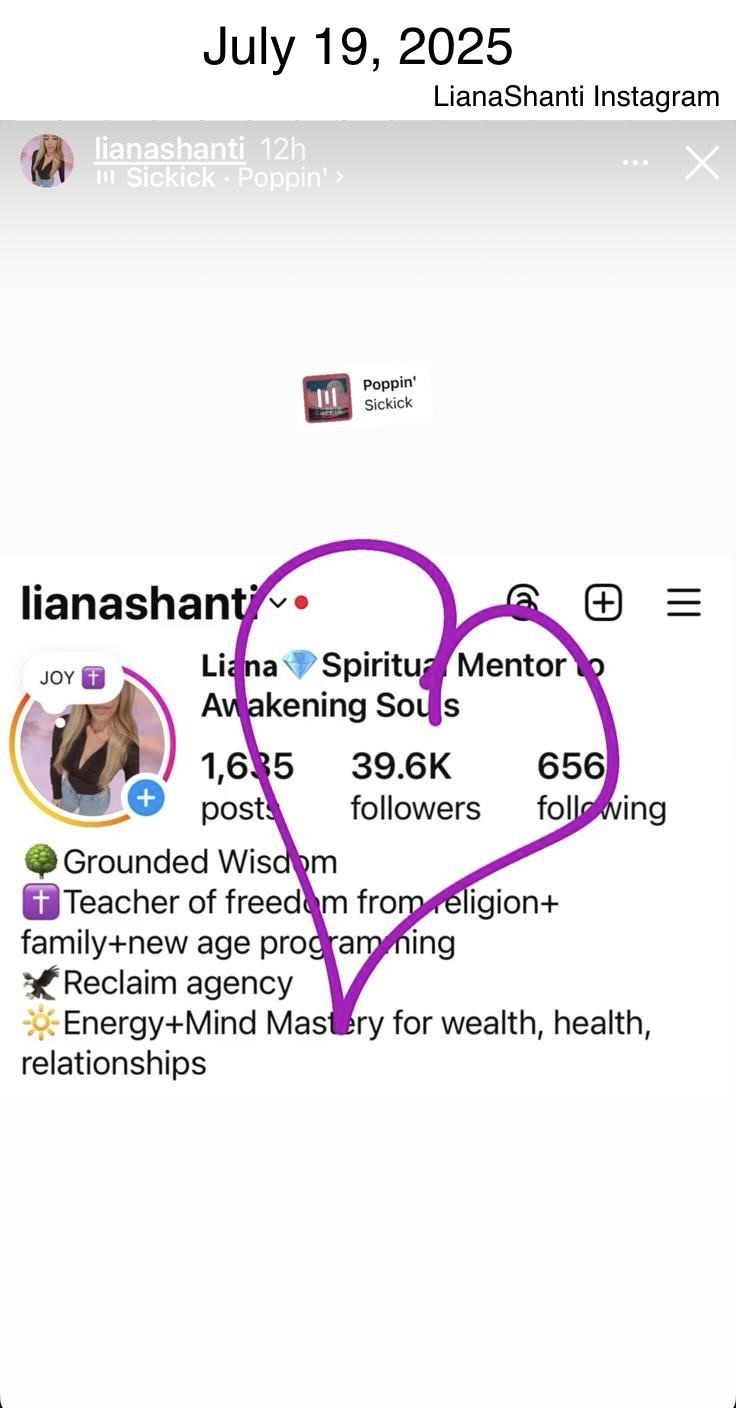
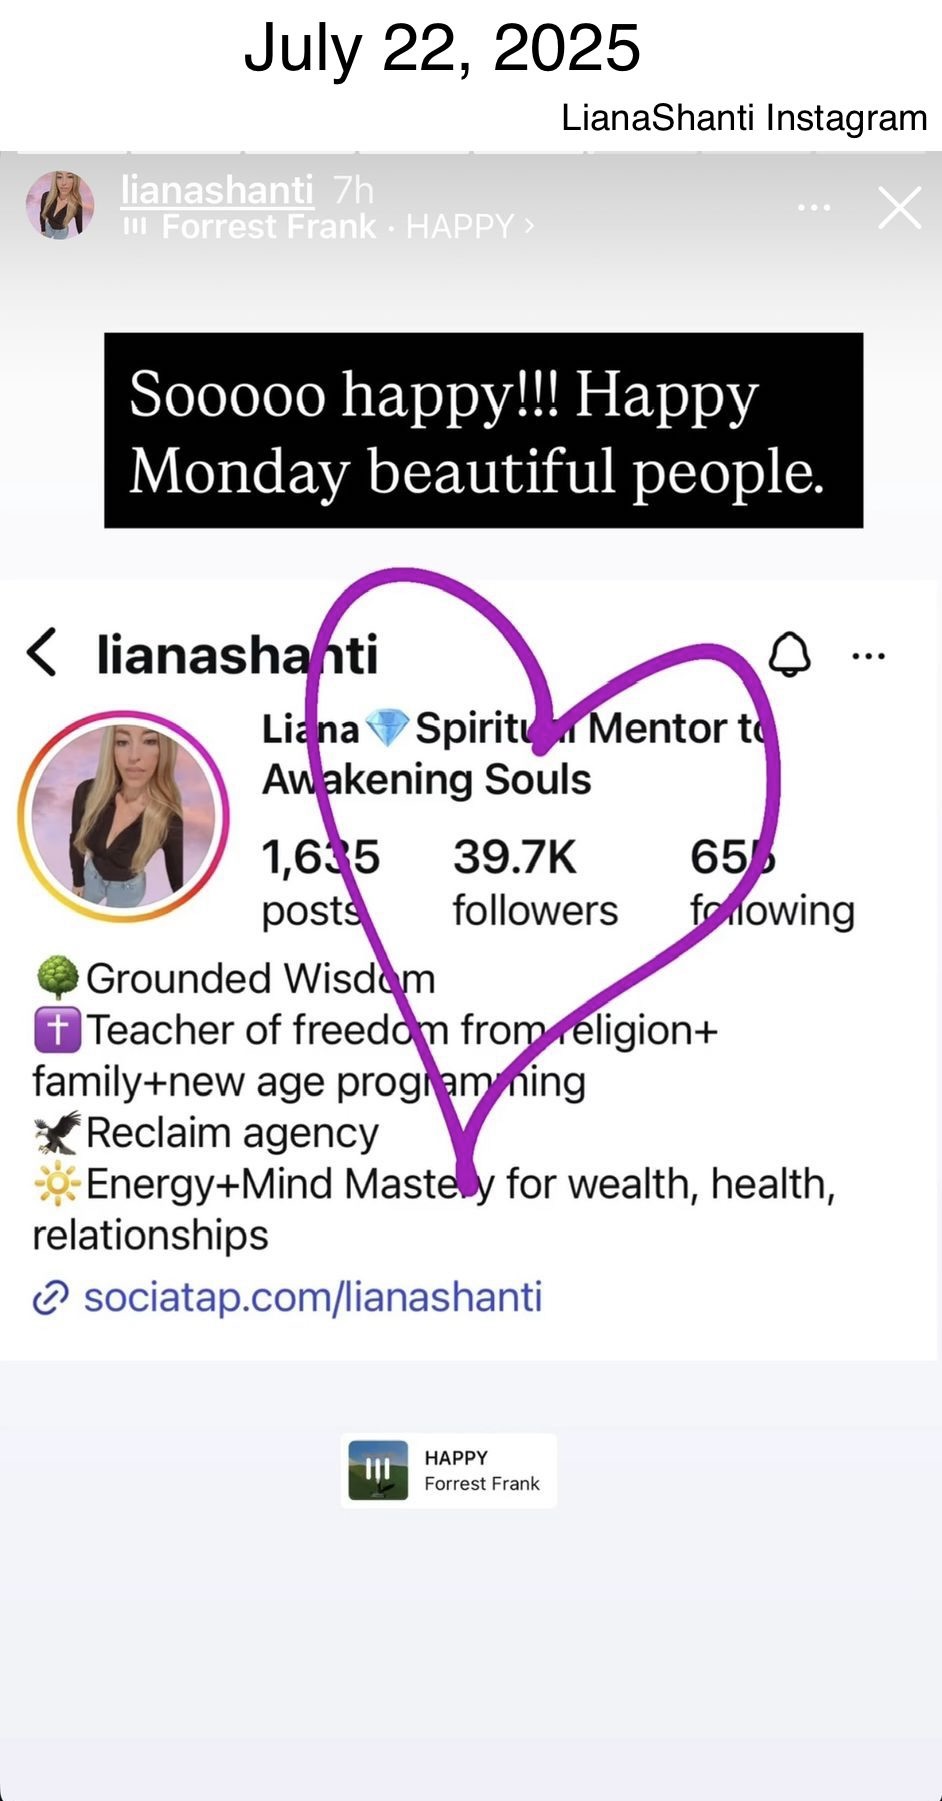
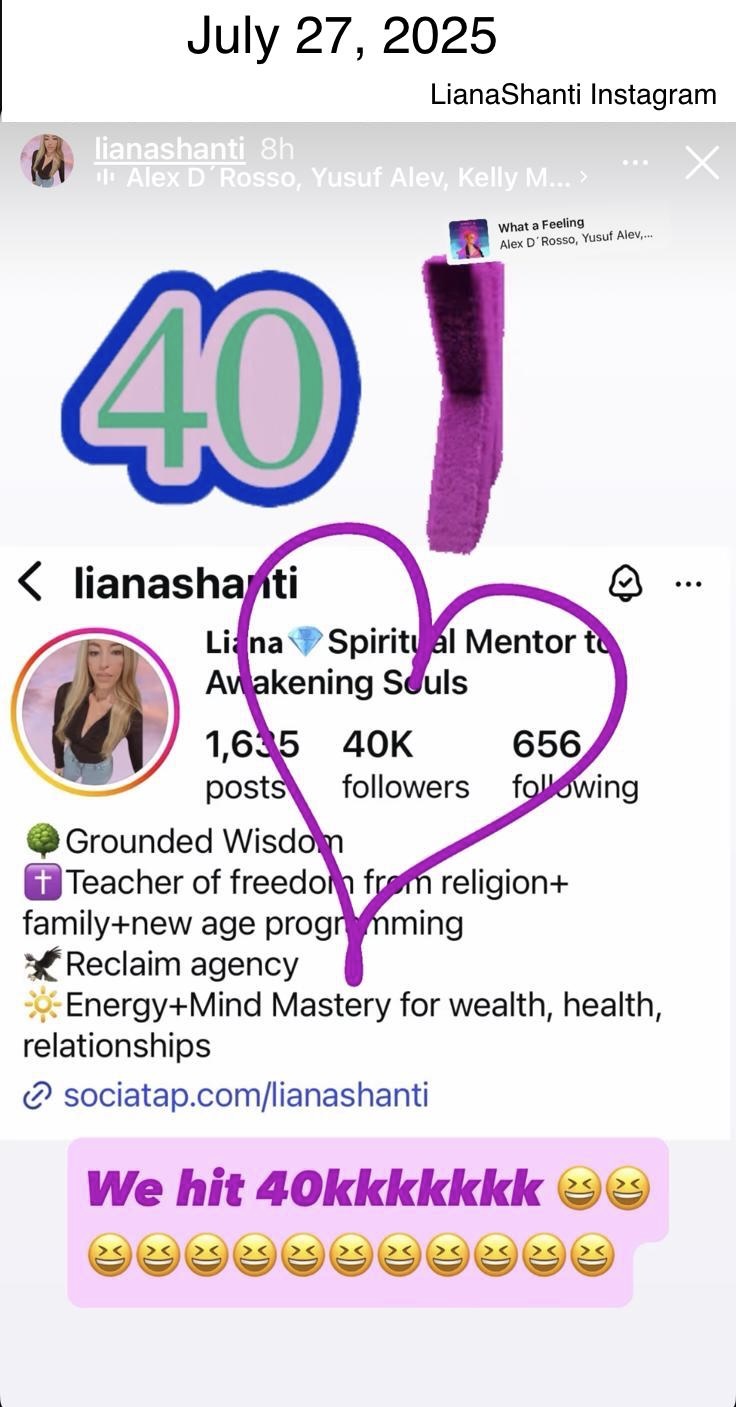
- Instagram Stories posted throughout the period repeatedly celebrate growth (e.g., “So much growth,” “We hit 40k!”) with hearts drawn around the follower count.
This report presents observations and questions arising from public data; it does not assert a definitive cause for the changes.
Historical Baseline vs. August 2025 Collapse
Baseline Growth (selected periods)
| Window | Pattern | Typical Daily Change |
|---|---|---|
| Aug–Sep 2023 | Runs of positive days (e.g., +54, +83, +87) with occasional small negatives (−28, −10). | ~+30 to +60 |
| Feb–Mar 2024 | Mostly positive days (e.g., +32, +35, +38), rare small negatives (−2 to −4). | ~+20 to +40 |
| Jul 2025 (pre-event) | Steady gains for both accounts. | ≈ +50/day (mean) |
Aug 10–16, 2025 (Two Accounts, Synchronized)
| Date | Account A Δ | Account B Δ | Notes |
|---|---|---|---|
| Aug 10 | −817 | −1,570 | Account B Media Count −74 |
| Aug 11 | −465 | −323 | |
| Aug 12 | −303 | −319 | |
| Aug 13 | +2 | +6 | |
| Aug 14 | −832 | −743 | |
| Aug 15 | −249 | −257 | |
| Aug 16 | −230 | −271 | |
| Total | −2,894 | −3,477 | Combined −6,371 |
Source PDFs:
Account A Liana Shanti Instagram Followers PDF
Account B 12D_B_School Instagram Followers PDF.
Probability Sanity Check (Conservative)
Baselines (from July 2025 windows)
| Account | Mean μ | Std Dev σ | Window |
|---|---|---|---|
| Account A | +49.8/day | ≈15.1 | Jul 18–31 (14d) |
| Account B | +51.7/day | ≈12.4 | Jul 13–31 (19d) |
Approximated from the provided SocialBlade lines; used only for “order-of-magnitude” checks.
Tail Magnitudes (selected days)
| Observation | Z-score | 1-tail Probability |
|---|---|---|
| Account A: −271 | ≈ −21.2σ | < 10−88 |
| Account A: −817 | ≈ −57.4σ | < 10−300 |
| Account A: −832 | ≈ −58.4σ | < 10−300 |
| Account B: −1,570 | ≈ −130.8σ | < 10−300 |
| Account B: −743 | ≈ −64.1σ | < 10−300 |
Under any reasonable distribution, events at 20–130σ magnitudes occurring on the same dates across two accounts are not credibly explained by ordinary churn.
Liane Wilson (Shanti) Self-Published Narrative Story Milestones vs. SocialBlade Trend leading up to removal.
Instagram Stories Highlighting “Growth”
- Story 1 – “So much growth 😆” (≈38.2K)
- Story 2 – ≈38.3K
- Story 3 – ≈38.0K
- Story 4 – ≈39.4K
- Story 5 – ≈38.1K
- Story 6 – ≈39.3K
- Story 7 – ≈39.6K
- Story 8 – ≈39.7K
- Story 9 – “We hit 40k!!!”
- See Complete Gallery
Concurrent SocialBlade Patterns (illustrative)
| Period | SocialBlade Signal | Notes |
|---|---|---|
| Late 2023 → Early 2025 | Mostly daily gains | Organic-looking streaks with rare small negatives. |
| Aug 1–9, 2025 | Negatives emerge | First sustained red days (e.g., −53, −54, −271, −250, −164). |
| Aug 10–16, 2025 | Large synchronized declines | Combined −6,371 across two accounts; Account B Media −74 on Aug 10. |
PDFs/screenshots here:
Account A Liana Shanti Instagram Followers PDF
Account B 12D_B_School Instagram Followers PDF.
Synchronization Across Two Accounts
The pattern of declines is temporally aligned across the two accounts (Aug 10–16, 2025). A simple correlation across overlapping dates yields
an approximate Pearson r ≈ 0.89. When one account plunged, the other did as well, often at substantial magnitude.
| Date | Direction | Comment |
|---|---|---|
| Aug 10 | Both large negatives | Account B also deleted 74 posts. |
| Aug 11 | Both negative | Moderate to large declines. |
| Aug 12 | Both negative | Continuing synchronized drop. |
| Aug 13 | Both slightly positive | Brief pause. |
| Aug 14–16 | Both negative | Resumption of synchronized declines. |
Possible Explanations (Non-Exhaustive)
- Platform enforcement removing inauthentic/compromised accounts.
- Deliberate cleanup by the operator (bulk blocks/removals).
- Content/PR events that led to post deletions and followership corrections.
- Ordinary churn — statistically unlikely at the observed magnitudes and synchronization.
Methodology
- Data sources: SocialBlade daily metrics (PDF exports + screenshots) for two Instagram accounts; Instagram Stories highlighting follower milestones.
- Approach: Descriptive tabulations; comparison of baseline windows (Jul 2025) vs. Aug 10–16, 2025; rough normal-approximation tail checks; simple correlation of daily changes across accounts.
- Why a normal approximation? It provides a conservative order-of-magnitude sanity check; the specific distribution of daily follower change is unknown and may be non-normal.
- Limitations: SocialBlade reflects platform-reported counts and can lag; precise Story timestamps vs. daily rollups may not align to the hour; therefore, conclusions are framed as observations & questions, not definitive attributions of cause.
Disclaimer
- This article is an AI-assisted forensic review of publicly available data
- Sample size of more than twenty SocialBlade captures (Aug 2023–Aug 2025)
- Two SocialBlade PDF exports dated Aug 16, 2025, and ten-plus Liana Shanti self-published Instagram Story images
- Where follower counts are featured. Calculations are illustrative, using conservative probability checks to contextualize how unusual the observed changes are under ordinary churn.
- This report raises observations and questions and does not make definitive claims about the specific cause of follower changes. Readers should consult the linked source files and draw their own conclusions.